
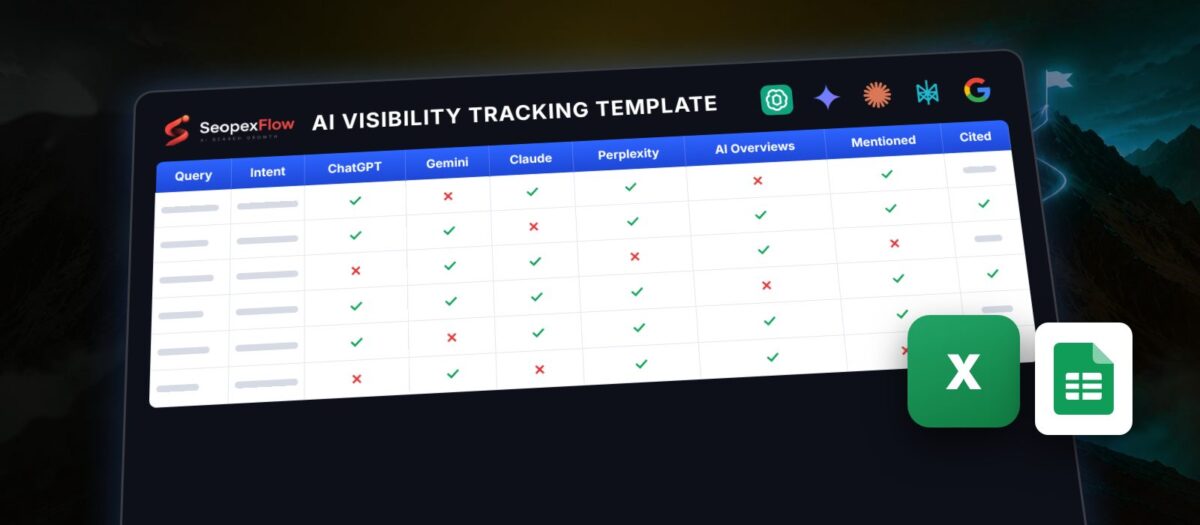
An organized workspace to log queries, record brand mentions and citations, and compare competitors across repeated tests — without mixing up the metrics. The template covers five major platforms in six worksheets with an automatic dashboard, as an Excel file that also works in Google Sheets.
What’s inside
- Project Settings — define your brand, domain, competitors and target market.
- Query Explorer — organize queries by intent, topic and priority.
- Observations — record every test with its source, date and platform.
- Dashboard — calculates mention and citation rates from the data you enter.
- Action Plan — turns observed gaps into actions and owners.
- Example Only — separate illustrative rows that are excluded from calculations.
How to use it
- Enter your brand and competitors in Settings.
- Add your target queries in Queries.
- Log each test result in Observations, with an evidence link where available.
- Review mention and citation rates in the Dashboard.
- Prioritize actions in the Action Plan.
To use it in Google Sheets: upload the file to Google Drive and open it with Google Sheets.
Important note
This is a manual logging template, not automated monitoring. Its rates reflect only the sample of tests you record; they do not represent overall share of visibility or guarantee traffic.
Learn the full method in How to measure your brand’s visibility in ChatGPT and Gemini. Want automated tracking across five platforms? Start with a free analysis.
